15 MANOVA: Multiple Analysis of Variance
At a glance
- Question
- Do two or more groups differ on a set of dependent variables considered together?
- Design
- Two or more independent groups, each participant measured on several DVs
- Dependent variables
- Two or more, interval or ratio, related to each other
- Independent variable
- Nominal, two or more levels
- Assumptions
-
- Independent observations
- Multivariate normality, and no multivariate outliers
- Equal covariance matrices in the groups (Box’s test), and equal variances of each DV
- Null hypothesis
- The vectors of population means are equal
- Test statistic
- Wilks’ \Lambda, converted to an approximate F
- Effect size
- Partial \eta^{2}, for the multivariate test and for each DV
- If conditions fail
-
- The MANOVA is significant → A univariate ANOVA for each DV, with a Bonferroni correction for the number of DVs, to see where the groups differ
- Include in the write-up
-
- The assumption checks
- Wilks’ \Lambda = …, F(df1, df2) = …, p = …, and partial \eta^{2}
- The univariate results for each DV
Used to compare means of multiple criterion (dependent) variables between two or more groups defined by the predictor (independent) variable. A different data set is going to be used as an example for this analysis. To better understand the example, the study scenario is introduced below.
A research to study the effect of race stereotypical crimes was conducted with 105 participants. Three identical versions of a scenario about a crime, referencing one of three ethnicities (African-American, Hispanic, Caucasian) were randomly presented to the participants. The study measured11 Column labels are: ethnicity, punish, repeats, and dispos.:
1 Column labels are: ethnicity, punish, repeats, and dispos.
- Dependent variables:
- Perceived level of punishment (“punish”);
- Perceived likelihood of committing the same crime again (“repeat”);
- Perceived likelihood that the reason the defendant committed the crime was due to his/her character, or disposition (“dispos”);
- Independent variable:
- Ethnicity22 Labels used for the independent variable, ethnicity, are: 0 = African-American, 1 = Hispanic, and 2 = Caucasian..
2 Labels used for the independent variable, ethnicity, are: 0 = African-American, 1 = Hispanic, and 2 = Caucasian.
- Ethnicity22 Labels used for the independent variable, ethnicity, are: 0 = African-American, 1 = Hispanic, and 2 = Caucasian..
Hypotheses.
- Null Hypothesis (H0): In the population, there is no difference in perceived level of punishment to be administered to the defendant, perceived likelihood the defendant will commit the same crime again, and the perceived likelihood that the reason the defendant committed the crime was due to his or her character for African-American, Hispanic, and Caucasian ethnicities.
- Alternative Hypothesis (H1): In the population, at least one ethnicity group differs from the others on the combination of the three dependent variables.
Decision criteria. The significance level is set at \alpha = .05. The test statistic is Wilks’ Lambda (\Lambda), converted to an approximate F value. H0 is rejected if the p-value of that F is smaller than \alpha. If it is, the univariate tests show which dependent variables contribute to the difference.
The analysis is a one-way MANOVA for a between groups design.
15.1 Outliers
To determine whether the data set has outliers let’s use a graphical representation. The primary plot represents the ordered squared robust Mahalanobis distances against the empirical distribution function MD^2_i. Of the three additional graphs the first shows the data, the second attempts to highlight potential outliers as detected using the chisq_p distribution, and the third presenting the outliers by the adjusted quantile (Filzmoser et al. 2005).
Projection to the first and second robust principal components.
Proportion of total variation (explained variance): 0.9381427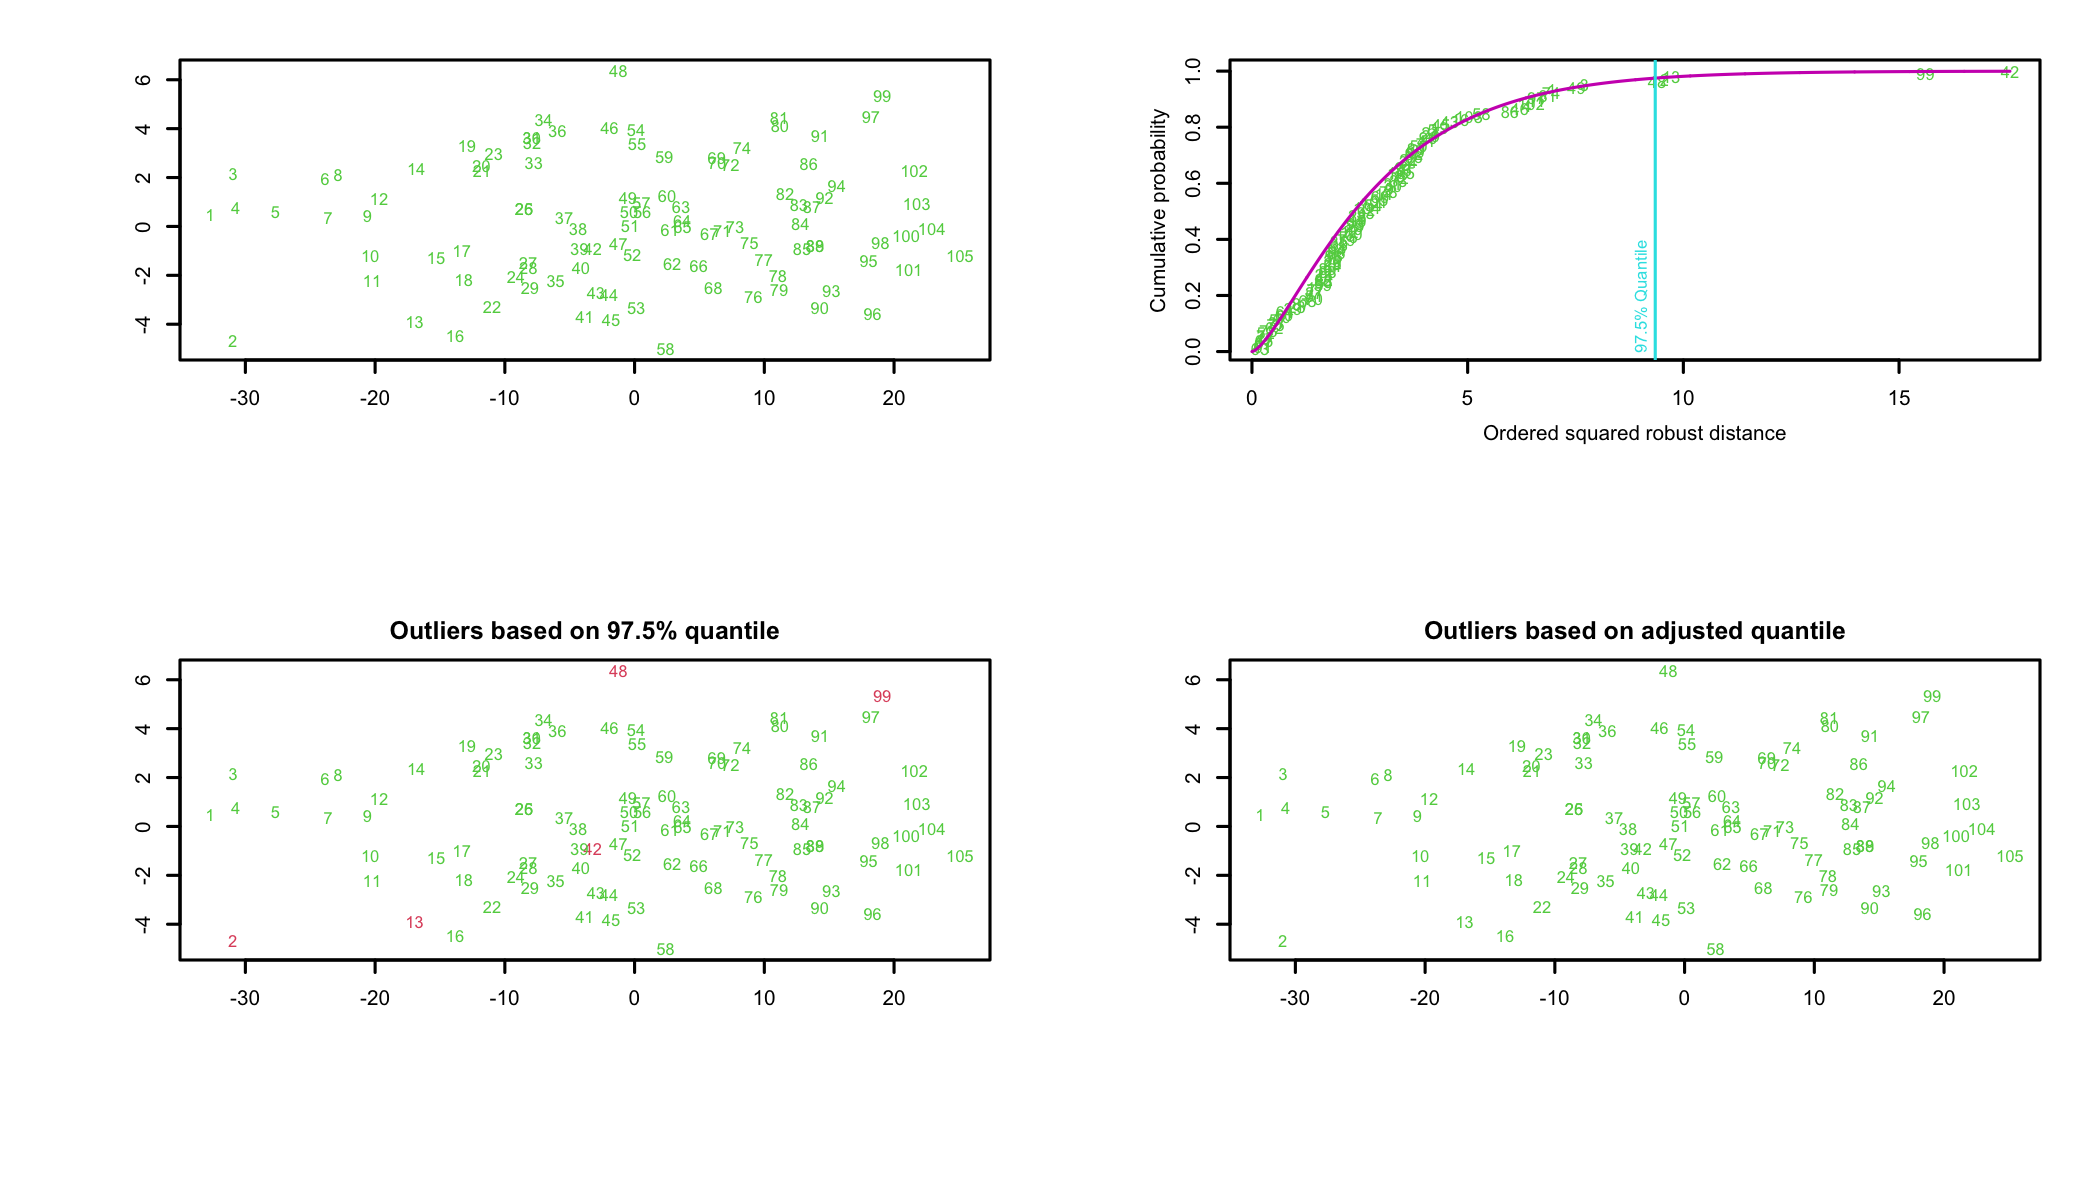
Two of plots in Figure 15.1 show two cases, 42 and 99, as potential outliers while the third, the outliers based on adjusted quantiles, suggests that the dataset has no outliers. In this case, the decision is left to the researcher. Each outlier should be analyzed individually and a decision should be made if it is to be removed or not. The criteria used for such decisions can range from theoretical necessity of including the possible outliers in the analysis to the point highlighted as outlier to be a valid data point based on an in-depth analysis of the data. In this example, because the analysis does not conclusively highlight the two cases as outliers, they will not be removed33 A more extensive analysis, outside the scope of this chapter, focused on the two possible outliers conducted on the dataset led to the same conclusion..
3 A more extensive analysis, outside the scope of this chapter, focused on the two possible outliers conducted on the dataset led to the same conclusion.
15.2 Assumptions
Before conducting the analysis, assumptions of normality, homogeneity of covariances, homogeneity of variances, and independence of observations need to be tested.
Summary statistics including skewness and kurtosis44 In the output, X1 refers to the dependent variable being analyzed: punish, repeats, dispos..
4 In the output, X1 refers to the dependent variable being analyzed: punish, repeats, dispos.
DV: punish
 Descriptive statistics by group
group: African-American
   vars  n  mean    sd median trimmed   mad min max range skew kurtosis   se
X1    1 24 49.33 11.09   50.5   49.25 13.34  30  71    41 0.08    -1.13 2.26
------------------------------------------------------------
group: Hispanic
   vars  n  mean    sd median trimmed   mad min max range  skew kurtosis   se
X1    1 26 57.77 14.71   60.5   58.64 16.31  28  79    51 -0.55    -0.68 2.89
------------------------------------------------------------
group: Caucasian
   vars  n  mean    sd median trimmed   mad min max range  skew kurtosis   se
X1    1 55 65.89 10.54     67   65.91 11.86  46  85    39 -0.04    -1.13 1.42
The output shows various basic statistics, such as the mean of the variable, its median, mean, and so forth. Of interest here is the reported swkewness and kurtosis. The values do not suggest a departure from normality for the punish variable in any of the three ethnic groups. A similar analysis is performed below for the two other variables in the analysis, repeats and dispos. In each case, the skewness and kurtosis are well within the limits.
DV: repeats
 Descriptive statistics by group
group: African-American
   vars  n  mean   sd median trimmed  mad min max range skew kurtosis   se
X1    1 24 24.12 2.17     24   24.05 2.97  21  28     7 0.26    -1.24 0.44
------------------------------------------------------------
group: Hispanic
   vars  n  mean   sd median trimmed  mad min max range skew kurtosis   se
X1    1 26 24.23 2.25     24   24.32 2.97  20  28     8 -0.3       -1 0.44
------------------------------------------------------------
group: Caucasian
   vars  n  mean   sd median trimmed  mad min max range  skew kurtosis   se
X1    1 55 25.53 1.99     26   25.58 1.48  21  29     8 -0.21    -0.62 0.27
DV: dispos
 Descriptive statistics by group
group: African-American
   vars  n mean   sd median trimmed  mad min max range skew kurtosis   se
X1    1 24   23 2.27     23    22.9 2.97  20  28     8 0.26    -1.03 0.46
------------------------------------------------------------
group: Hispanic
   vars  n  mean   sd median trimmed  mad min max range  skew kurtosis  se
X1    1 26 23.46 2.04     24   23.45 1.48  20  27     7 -0.15     -1.1 0.4
------------------------------------------------------------
group: Caucasian
   vars  n  mean   sd median trimmed  mad min max range  skew kurtosis   se
X1    1 55 24.91 2.47     25   25.07 2.97  20  29     9 -0.44    -0.84 0.33
15.2.1 Visual Evaluation of Data Normality
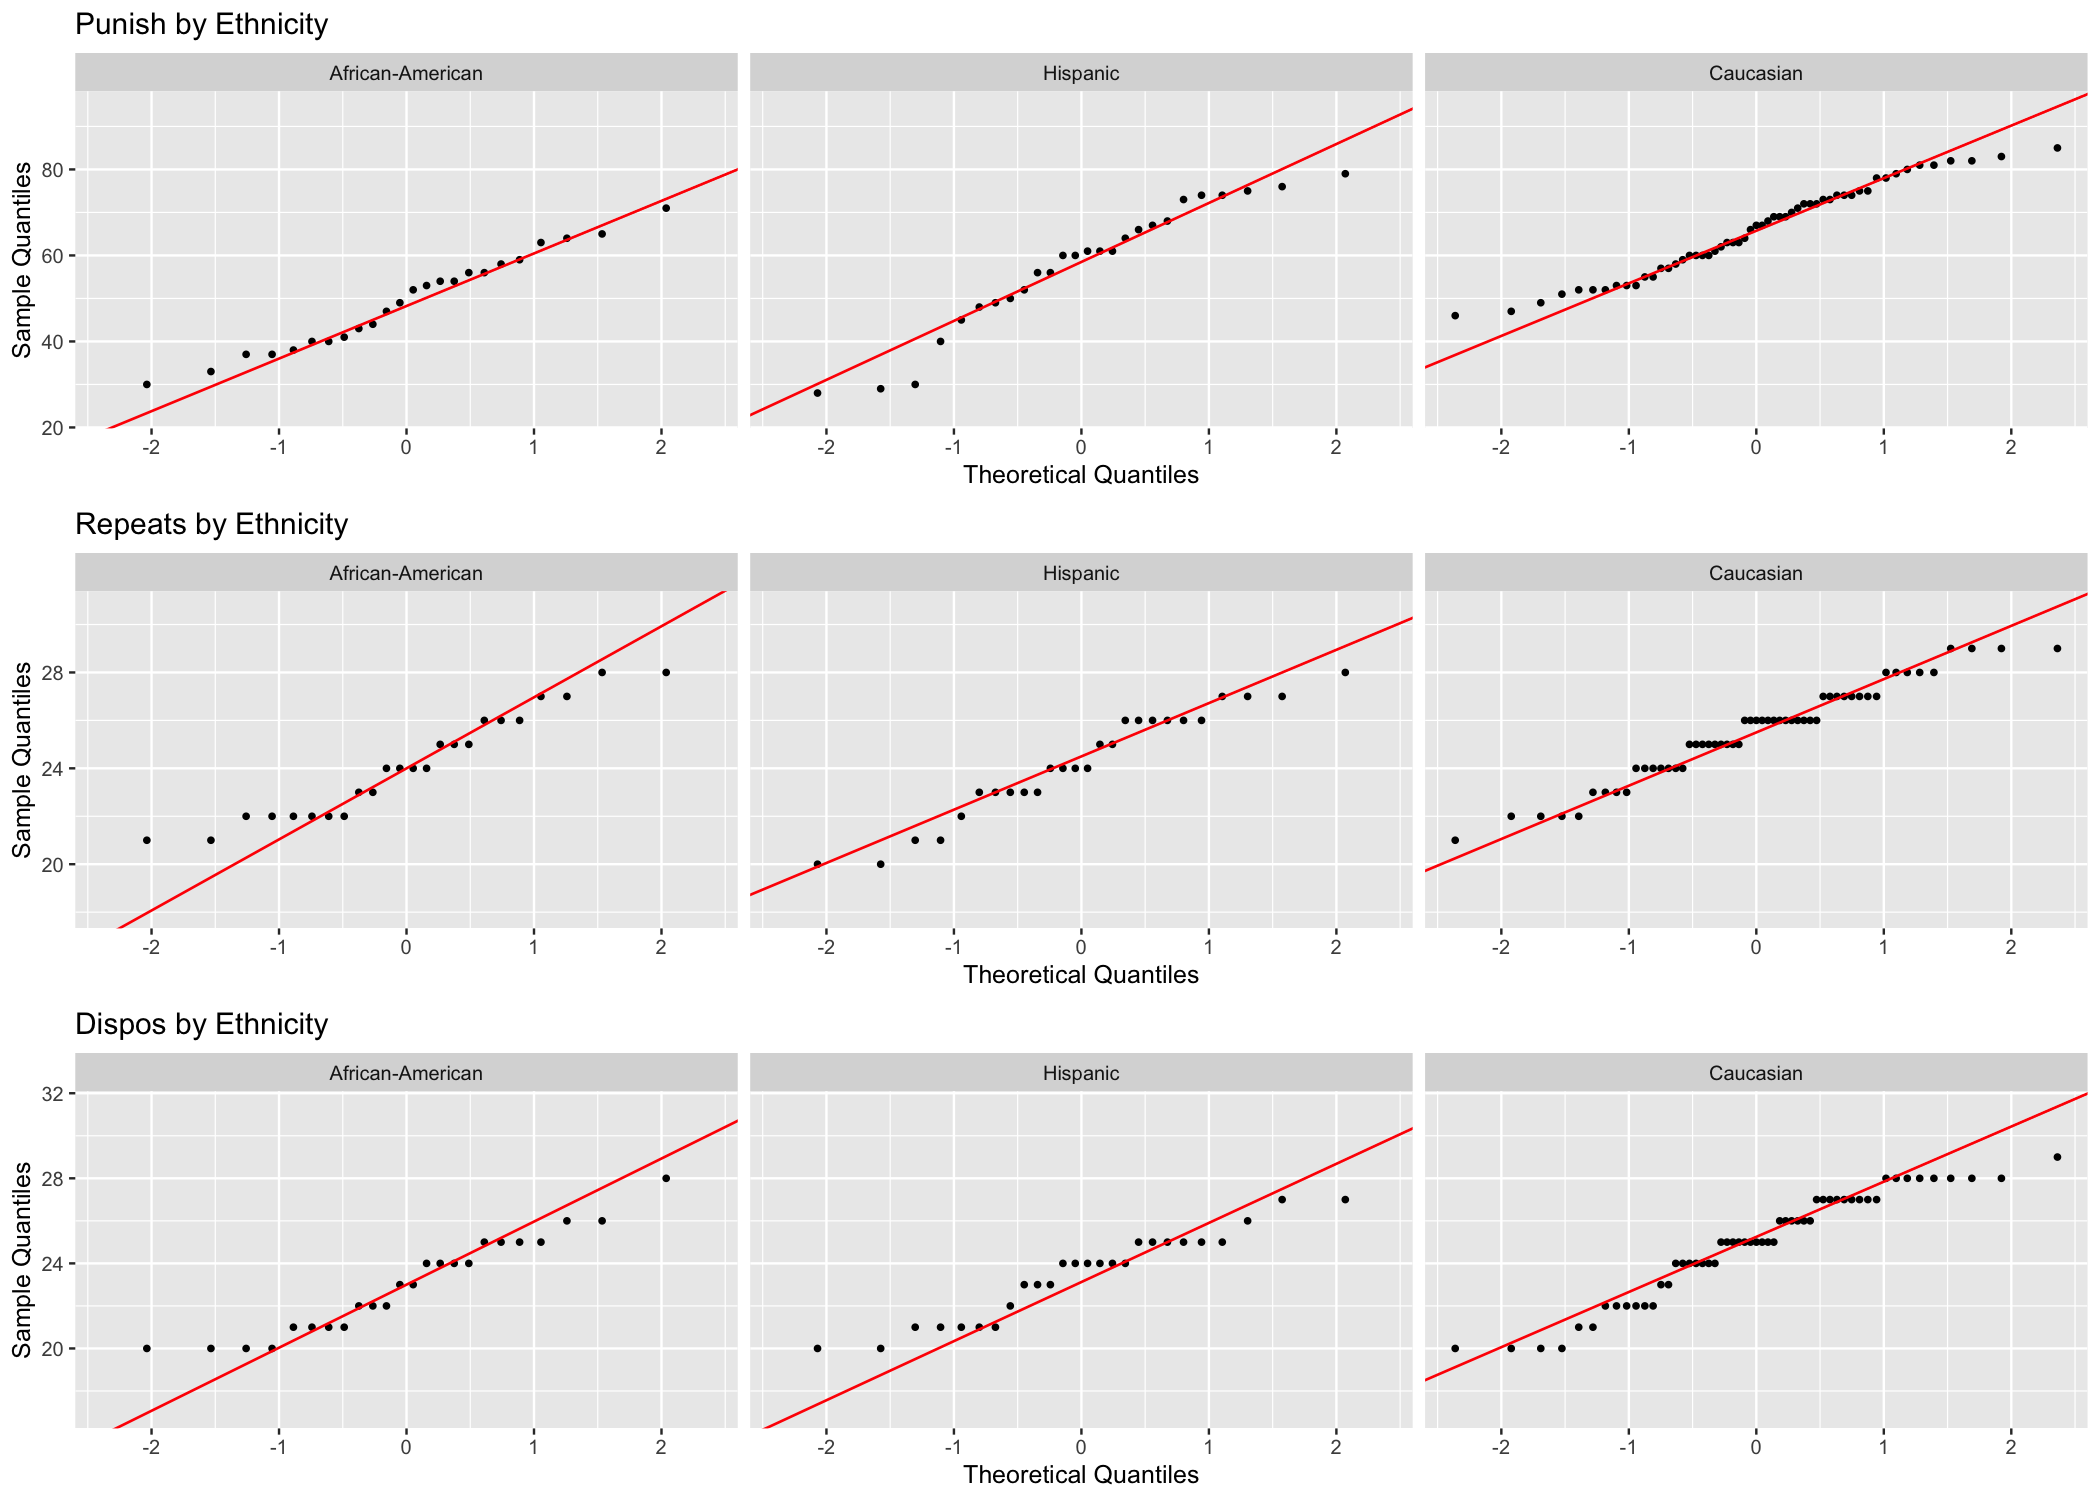
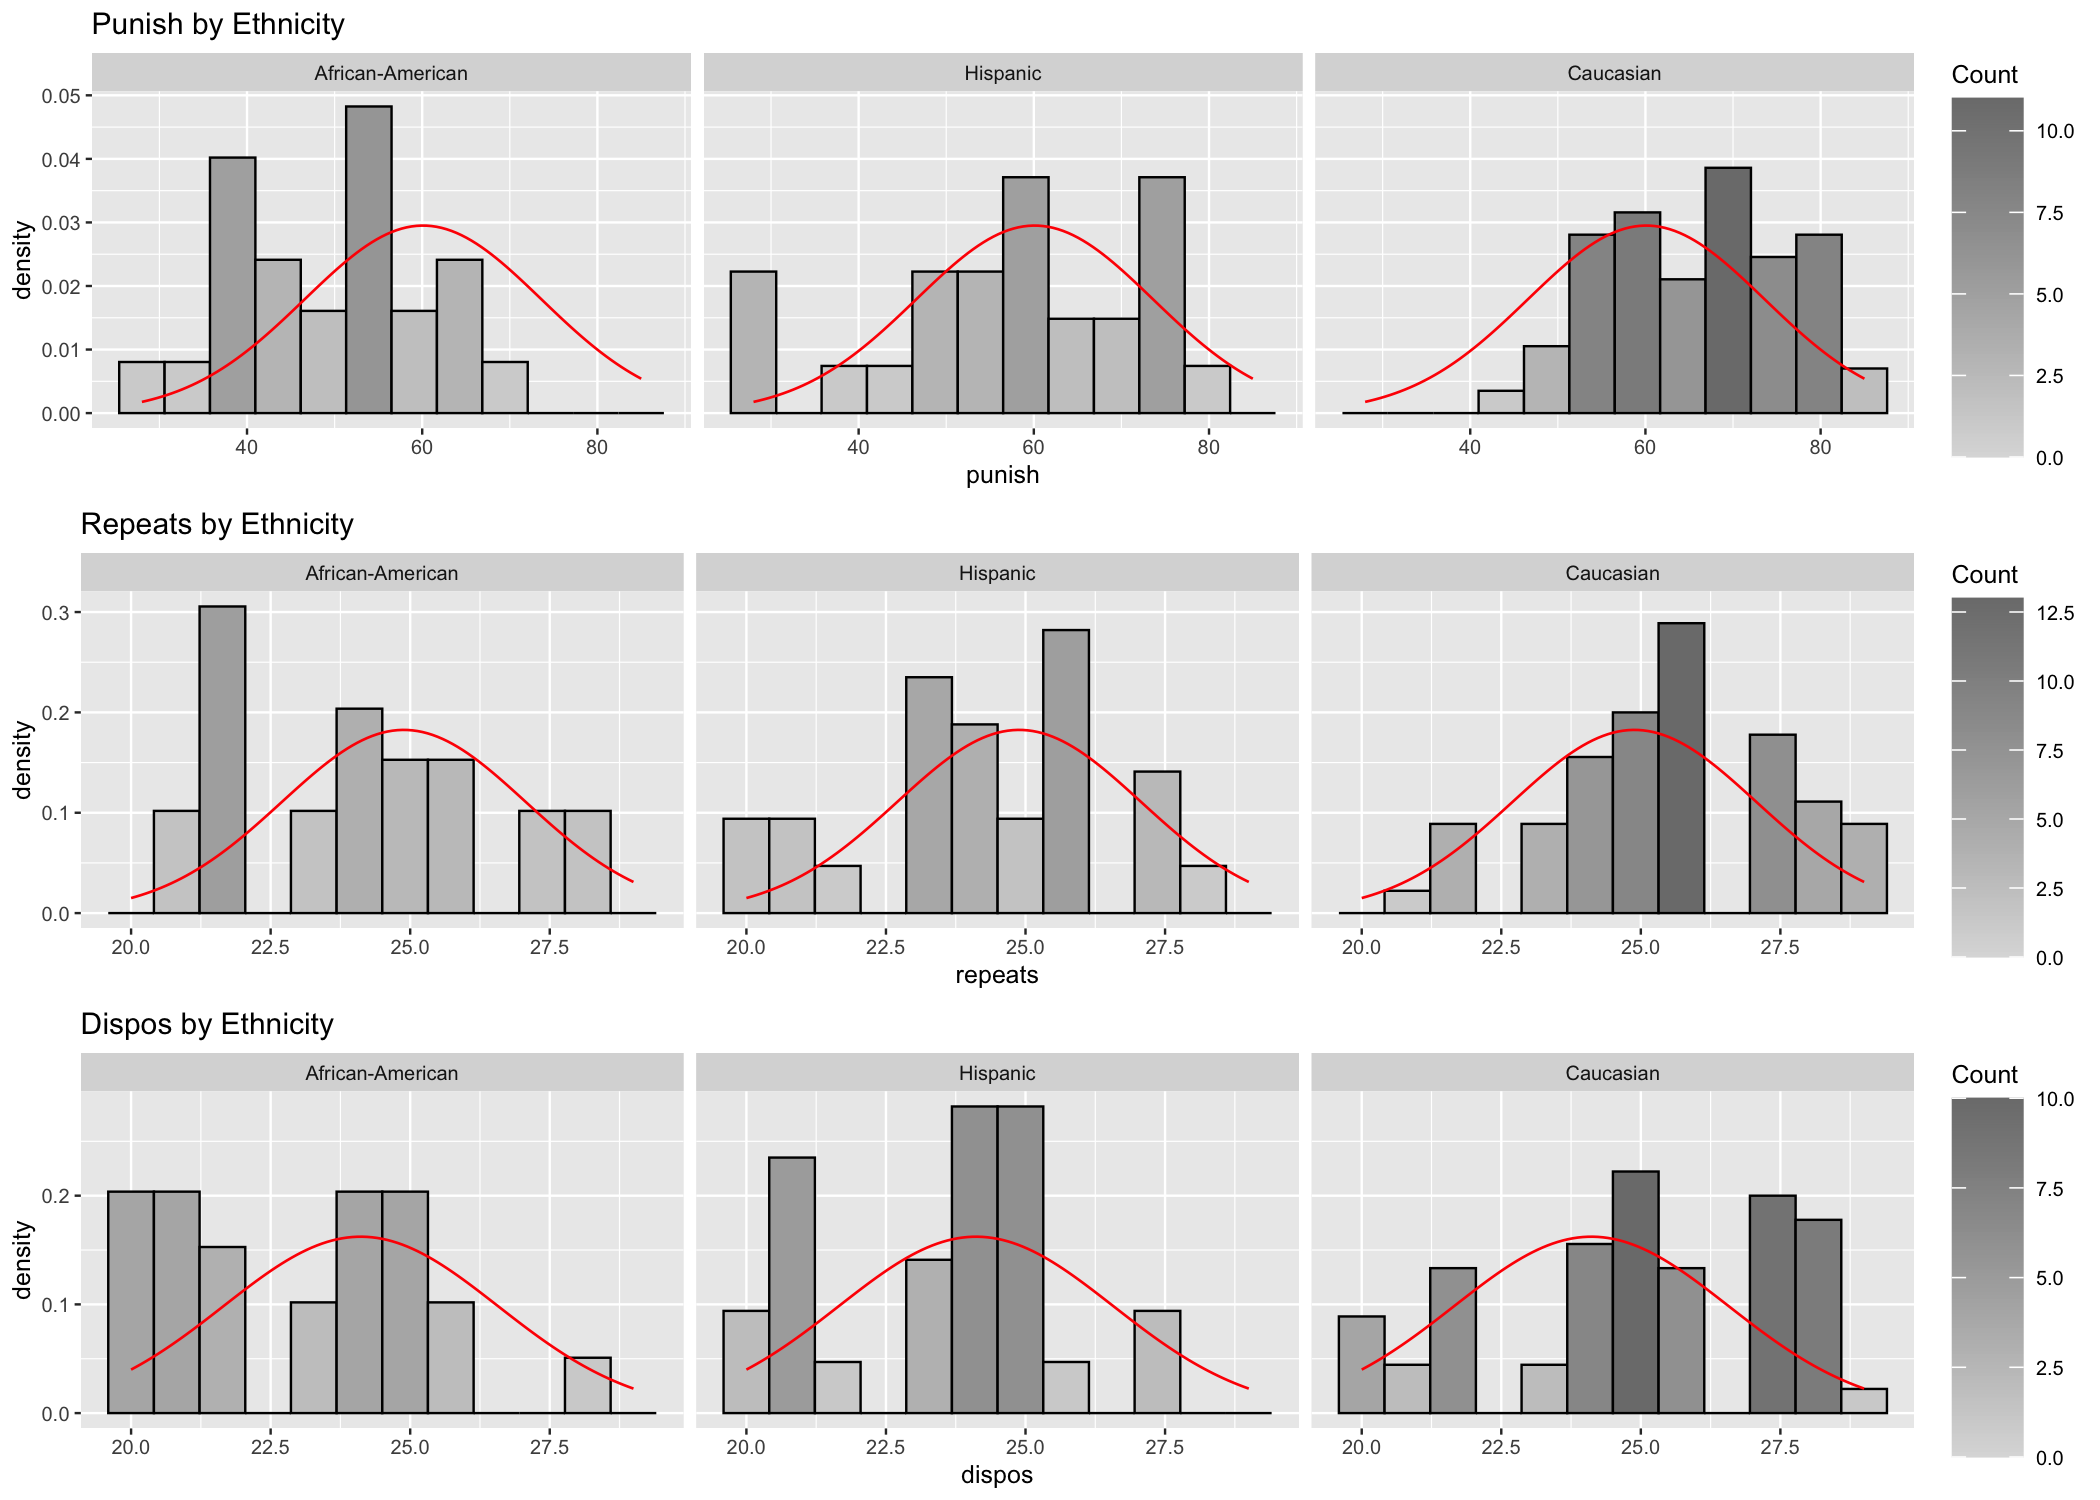
For analysis we produce the appropriate qq-plots (Fig. 15.2) and histograms (Fig. 15.3). A cursory review of the plots seem to suggest that departure from normality may exist, at least for some of the groups. Observe the top-left plot in Fig. 15.2 (level of punishment for African Americans). The points representing the data align neatly along the diagonal line, which suggests that the data is close to a normal distribution. Other plots show an S-shaped distribution of the data point alongside the diagonal, which suggests departures from normality. The histograms in Fig. 15.3 seem to suggest similar possible departures from normality. In this situation further analysis is necessary to determine if the assumption of normality is met.
15.2.2 Shapiro-Wilk Test of Normality
Shapiro-Wilks is used to test normality of data for each subgroup. Table 15.1 combines summary statistics and the Shapiro-Wilk test for the design groups.
| Dependent Variable | Ethnicity | Statistic | df | Sig. |
|---|---|---|---|---|
| Level of punishment | African American | 0.97 | 25 | 0.703 |
| Hispanic | 0.94 | 26 | 0.110 | |
| Caucasian | 0.97 | 55 | 0.130 | |
| Potential to repeat | African American | 0.93 | 25 | 0.101 |
| Hispanic | 0.95 | 26 | 0.183 | |
| Caucasian | 0.96 | 55 | 0.087 | |
| Natural disposition | African American | 0.95 | 25 | 0.132 |
| Hispanic | 0.93 | 26 | 0.079 | |
| Caucasian | 0.94 | 55 | 0.005 |
Table 15.1 shows that most of the cells (with the exception of the last line in the table), have a low significance level that may be indicative of the fact that even if the Shapiro-Wilk test finds no significant departure from normality, its distribution in each cell is not as close to the normal distribution as one would want it to be.
15.2.3 Equality of Covariance Matrices
The homogeneity of covariances can be analyzed using Box’s test55 Box’s test checks whether the covariance matrices are equal, not whether the data are multivariate normal.. With an observed significance of .2 the null hypothesis, stating that the covariance matrices of the dependent variables are equal across groups, cannot be rejected.
5 Box’s test checks whether the covariance matrices are equal, not whether the data are multivariate normal.
 Box's M-test for Homogeneity of Covariance Matrices

data:  variables by my.manova$ethnicity
Chi-Sq (approx.) = 16.7158, df = 12, p-value = 0.1606
Levene’s test of equality of error variances:
Level of PuhishmentLevene's Test for Homogeneity of Variance (center = median)
Df F value Pr(>F)
group 2 1.1418 0.3233
102 Potential to RepeatLevene's Test for Homogeneity of Variance (center = median)
Df F value Pr(>F)
group 2 0.5506 0.5783
102 Natural DispositionLevene's Test for Homogeneity of Variance (center = median)
Df F value Pr(>F)
group 2 0.6535 0.5224
102 Levene’s tests of equality of variances shows that the error variance of all three dependent variables is equal across groups.
One last assumption to consider - independence of observations - seems reasonable because the treatments were administered individually.
15.3 The MANOVA Test
Now that the assumptions have been tested and the results show that the data set is appropriate for analysis, run the MANOVA test.
           Df   Wilks approx F num Df den Df    Pr(>F)
ethnicity   2 0.73076     5.66      6    200 1.883e-05 ***
Residuals 102
---
Signif. codes:  0 '***' 0.001 '**' 0.01 '*' 0.05 '.' 0.1 ' ' 1
Decision. With \Lambda = 0.73, F(6, 200) = 5.66, p < .001, the p-value is smaller than \alpha = .05 and H0 is rejected: ethnicity has a significant effect on the three dependent variables taken together.
Effect size. To better understand what the results tell us let’s look at the effect size (\eta^{2}). The threshold values for evaluating the effect size (partial \eta^{2}) are .01 for small effect size, .06 for moderate effect size, and .14 for large effect size, as for the ANOVA. A value below .01 indicates a negligible effect, which is not the same as no effect.
              eta^2
ethnicity 0.1451526
The write-up may look like below:
Wilks’ \Lambda = .73, F(6, 200) = 5.66, p < .001, with a large effect size (partial \eta^{2} = .145, > .14), indicates a significant multivariate effect of ethnicity on the three dependent variables. Therefore, the null hypothesis (H0) can be rejected.
15.3.1 Univariate Statistics
While the MANOVA multivariate statistics looks the dependent variables together, it may also be of interest for researchers to look how ethnicity affects the behavior of each dependent variable individually in multivariate context. Each of the three follow-up ANOVAs carries its own risk of a Type I error, and a significant MANOVA does not protect them. To keep the familywise error rate at .05, each one is tested at \alpha = .05 / 3 = .017, a Bonferroni correction.
 Response 1 :
             Df  Sum Sq Mean Sq F value    Pr(>F)
ethnicity     2  4767.8 2383.88  17.072 4.026e-07 ***
Residuals   102 14243.3  139.64
---
Signif. codes:  0 '***' 0.001 '**' 0.01 '*' 0.05 '.' 0.1 ' ' 1

 Response 2 :
             Df Sum Sq Mean Sq F value   Pr(>F)
ethnicity     2  47.68 23.8395  5.4163 0.005814 **
Residuals   102 448.95  4.4015
---
Signif. codes:  0 '***' 0.001 '**' 0.01 '*' 0.05 '.' 0.1 ' ' 1

 Response 3 :
             Df Sum Sq Mean Sq F value   Pr(>F)
ethnicity     2  75.62  37.811  6.9741 0.001449 **
Residuals   102 553.01   5.422
---
Signif. codes:  0 '***' 0.001 '**' 0.01 '*' 0.05 '.' 0.1 ' ' 1
Level of Punishment Partial eta^2
ethnicity 0.2507886
Residuals NAPotential to Repeat Partial eta^2
ethnicity 0.09600554
Residuals NANatural Disposition Partial eta^2
ethnicity 0.1202961
Residuals NAThe univariate statistics analysis show that ethnicity has univariate effects on all three dependent variables as the significance p values for all three dependent variables are < .01, below the Bonferroni-corrected α of .017. For effect size, ethnicity shows a large effect size on the Level of punishment (punish) (partial \eta^{2} = .251), and moderate effect size on the other two dependent variables, Potential to repeat (repeat) and Natural disposition (dispos), which have values of partial \eta^{2} = .096 and .12 respectively.